Written in the Java programming language, this software can be used to visualize the data of different kinds of meteorological sensors in a variety of ways, especially suited for aviation meteorologists at airports.
The features of the software can be summarized as follows:
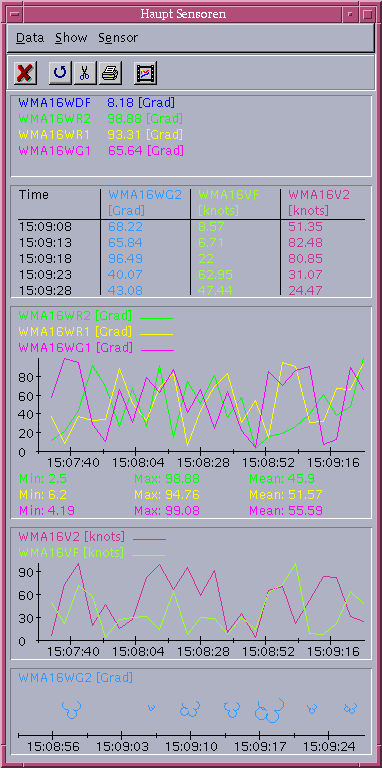
| Automatically retrieves the latest sensor data from a database and adds it to the display. | |
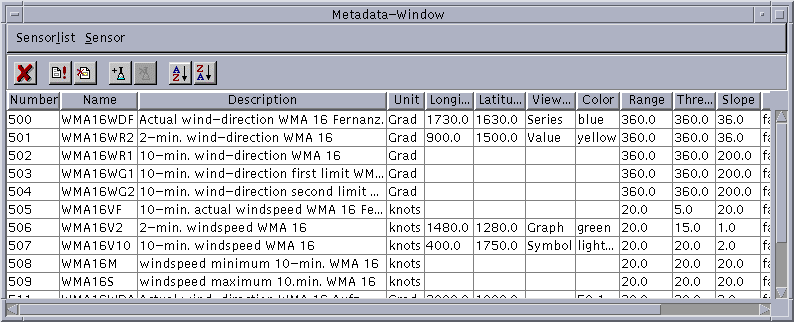
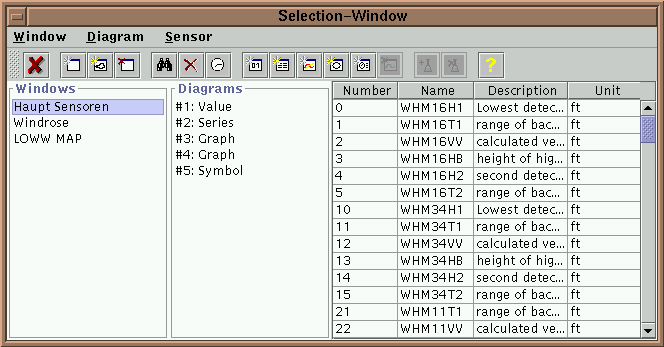
| Displays can be fully configured by the user. Each display may contain one or more sensors in different views. | |
| Each sensor can be viewed either as a line-graph, a table, a single number or a symbol which changes in size. | |
| Additionally an airport map can be used to see the location of the sensors. Each sensor may be toggled on/off directly in the map. | |
| Data limits can be set for each sensor value which cause the sensor to be displayed in red color if the value is exceeded. | |
| A movie feature allows to see the historical development of the sensor data. | |
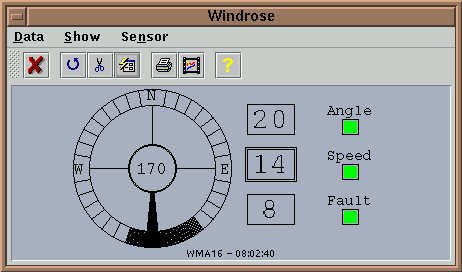
| Several sensors can be grouped to form a virtual sensor which can be used to control the display of a wind-rose (see below). | |
| The data can be printed as well. | |
| Runs on all computer platforms which support the Java2 run-time environment, for example: Windows, Sun/Solaris, Compaq/Digital Unix, IBM/AIX, Linux etc. |
For more informations, please contact us.
The following images show some examples of possible sensor displays: